Modeling a potential large landslide and resulting tsunami in Prince William Sound, Alaska
This page is a summary of, and features excerpts and figures from the following report:
Preliminary assessment of the wave generating potential from landslides at Barry Arm, Prince William Sound, Alaska., K.R. Barnhart, R.P. Jones, D.L. George, J.A. Coe, and D.M. Staley, 2021. USGS Open-File Report, 1071. pdf
Abstract
We simulated the concurrent rapid motion of landslides on an unstable slope at Barry Arm, Alaska. Movement of landslides into the adjacent fjord displaced fjord water and generated a tsunami, which propagated out of Barry Arm. Rather than assuming an initial sea surface height, velocity, and location for the tsunami, we generated the tsunami directly using a model capable of simulating the dynamics of both water and landslide material. The fjord below most of the landslide source area was occupied by the Barry Glacier until about 2012; therefore, our direct simulation of tsunami generation by landslide motion required new topographic and bathymetric data, which was collected in 2020. The topographic data also constrained landslide geometries and volumes. We considered four scenarios based on two landslide volumes and two landslide mobilities—a more mobile, contractive landslide and a less mobile, noncontractive landslide. The larger of the two volumes is 689 × 106 cubic meters (m3)—larger than the volume estimate in a previous study—and reflects the largest plausible volume given current observational data. The considered scenario that generated the largest wave heights resulted in forecast wave heights of over 200 meters (m) in the northern part of Barry Arm, adjacent to the landslide source area and runup on the opposite fjord wall in excess of 500 m. Simulated wave heights in excess of 5 m in southern Barry Arm and in Harriman Fjord occurred within 10–15 minutes (min) of landslide motion. The simulated tsunami reached Whittier, Alaska, approximately 20 min after initial rapid landslide motion, with peak heights of just over 2 m in Passage Fjord, 500 m offshore Whittier, occurring 26 min after initial rapid motion. Time of peak wave heights was consistent with previous modeling. Although results are preliminary and can be refined with additional observations and analyses, they provide a refined assessment of the upper bound of the hazard presented by the Barry Arm landslides. The results herein sup- port the National Oceanic and Atmospheric Administration’s National Tsunami Warning Center mission to detect, forecast, and warn for tsunamis in Alaska.
Introduction
When situated upslope of waterbodies, landslides have the potential to generate a tsunami by rapidly moving into the waterbodies and displacing water. This poses a hazard to nearby populations, infrastructure, and marine traffic. There are multiple recent instances of tsunamigenic landslides in steep maritime terrain in the Arctic and subarctic. These events are particularly problematic in areas that have experienced rapid glacial retreat, as (1) debuttressing of and (or) thermomechanical damage to steep valley sides may increase the susceptibility of valley walls to rapid landslide motion, and (2) rapid glacial retreat may increase the likelihood of landslide runout into open water rather than onto glacial ice that would have been present prior to glacial retreat. Examples of large tsunamigenic landslides in recently deglaciated terrain include July 9, 1958, Lituya Bay, Alaska (Miller, 1960a, b); April 27, 1975, Kitimat, British Columbia (Kirby and others, 2016); October 17, 2015, Taan Fjord, Alaska (George and others, 2017; Haeussler and others, 2018; Higman and others, 2018); and June 17, 2017, Karrat Fjord, Greenland (Poli, 2017; Gauthier and others, 2018).
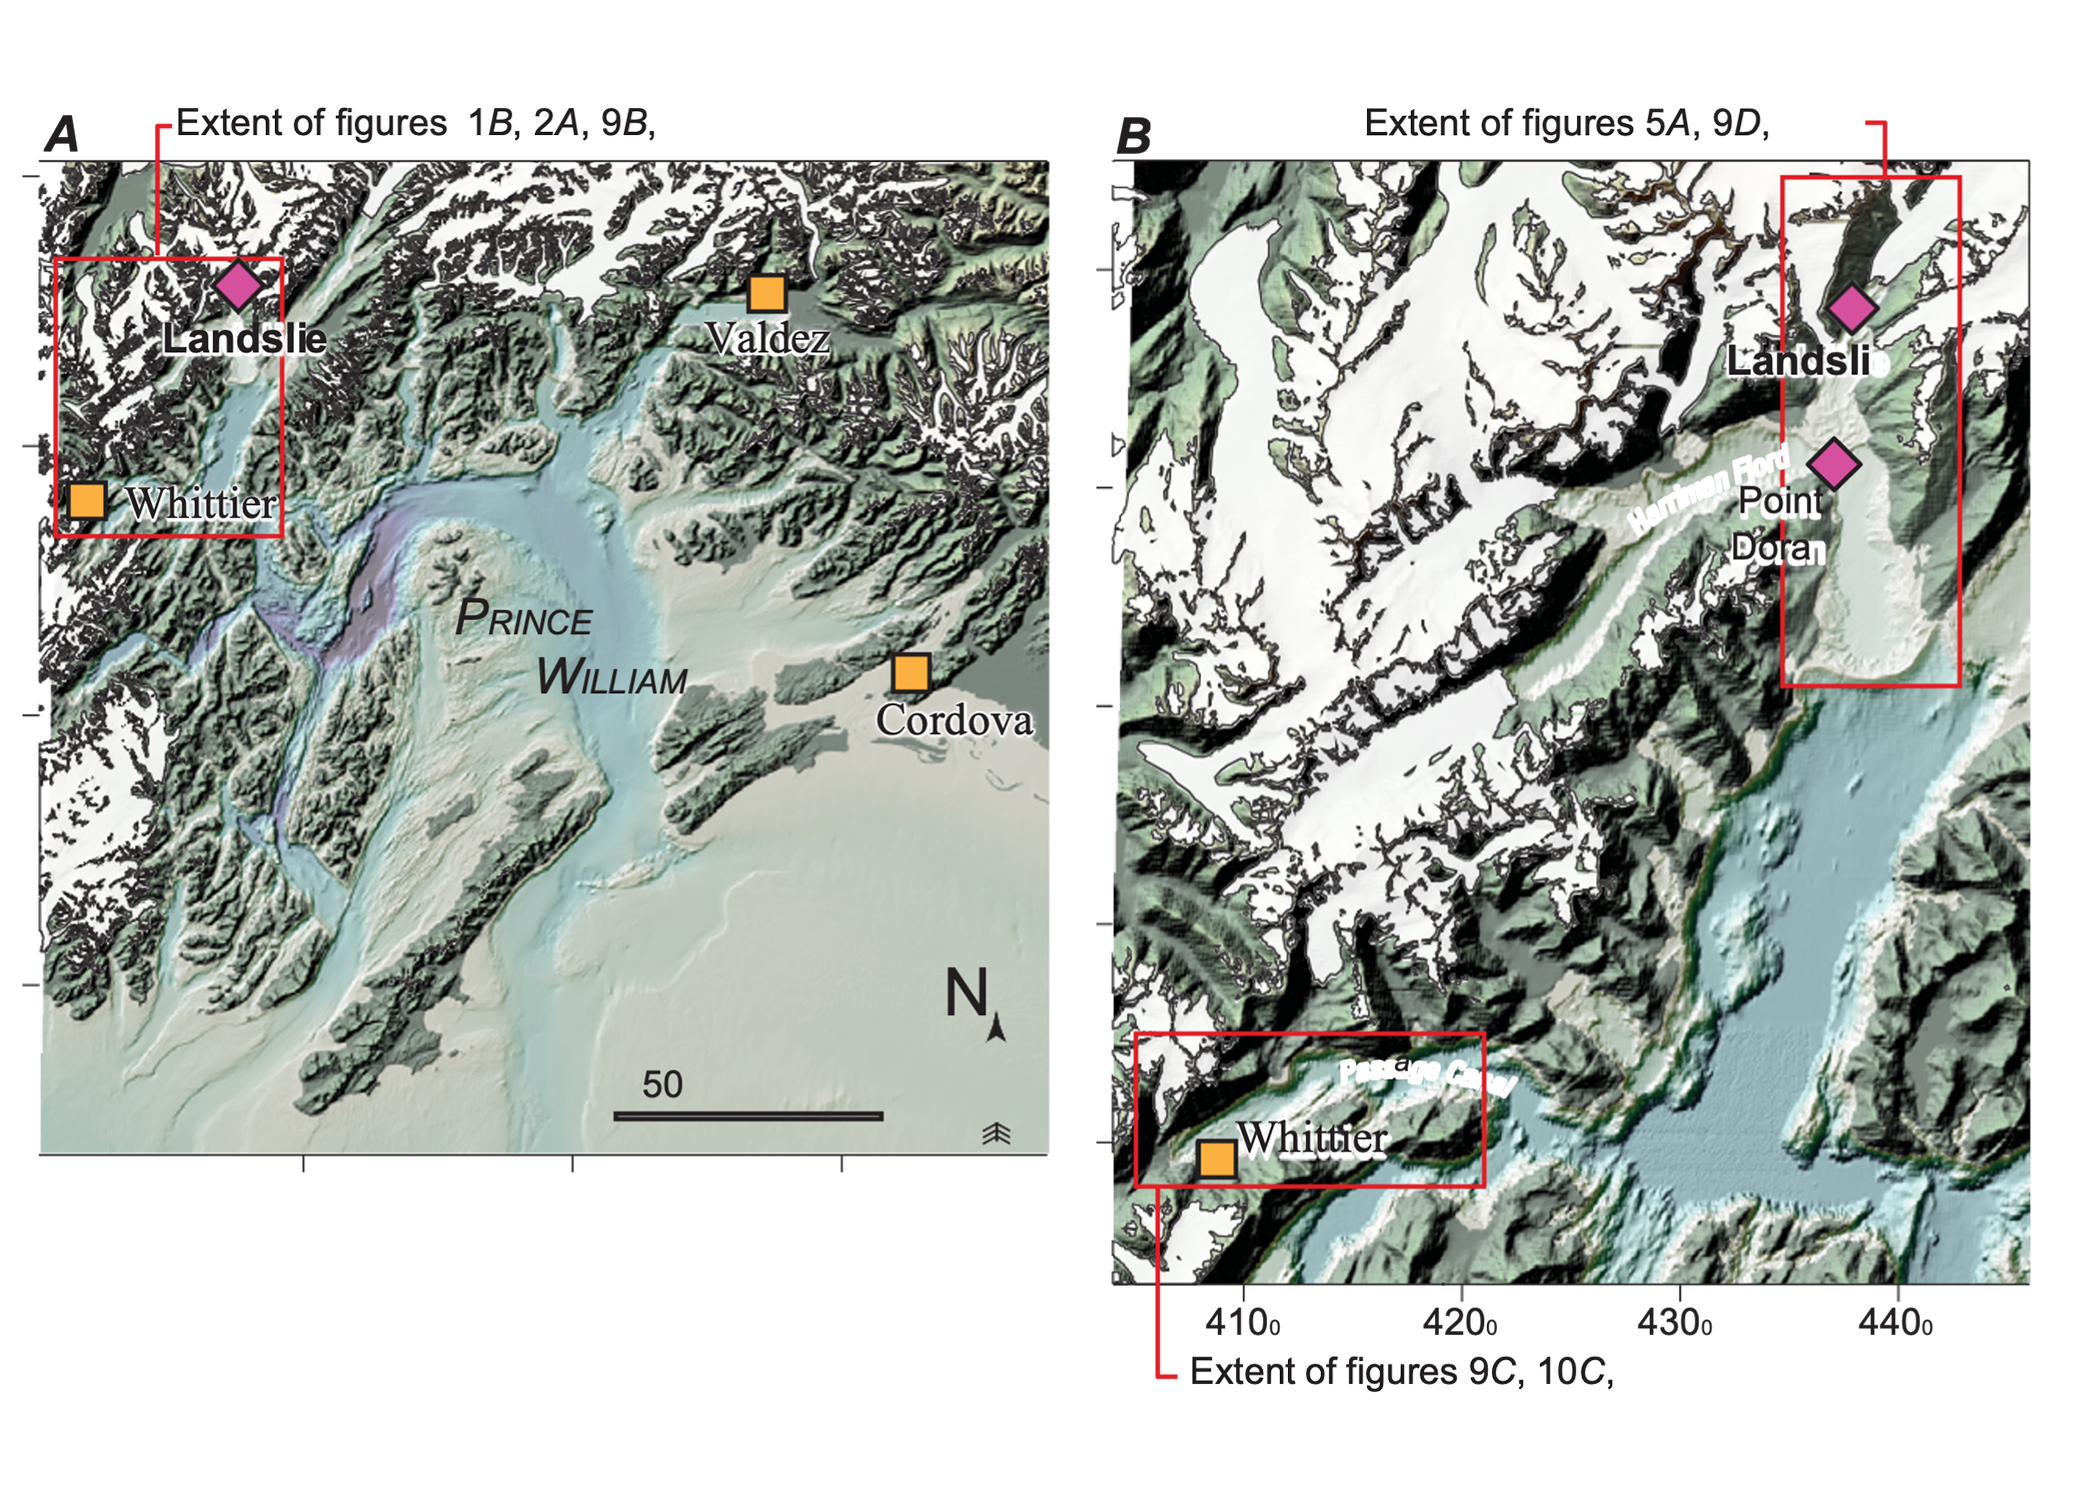
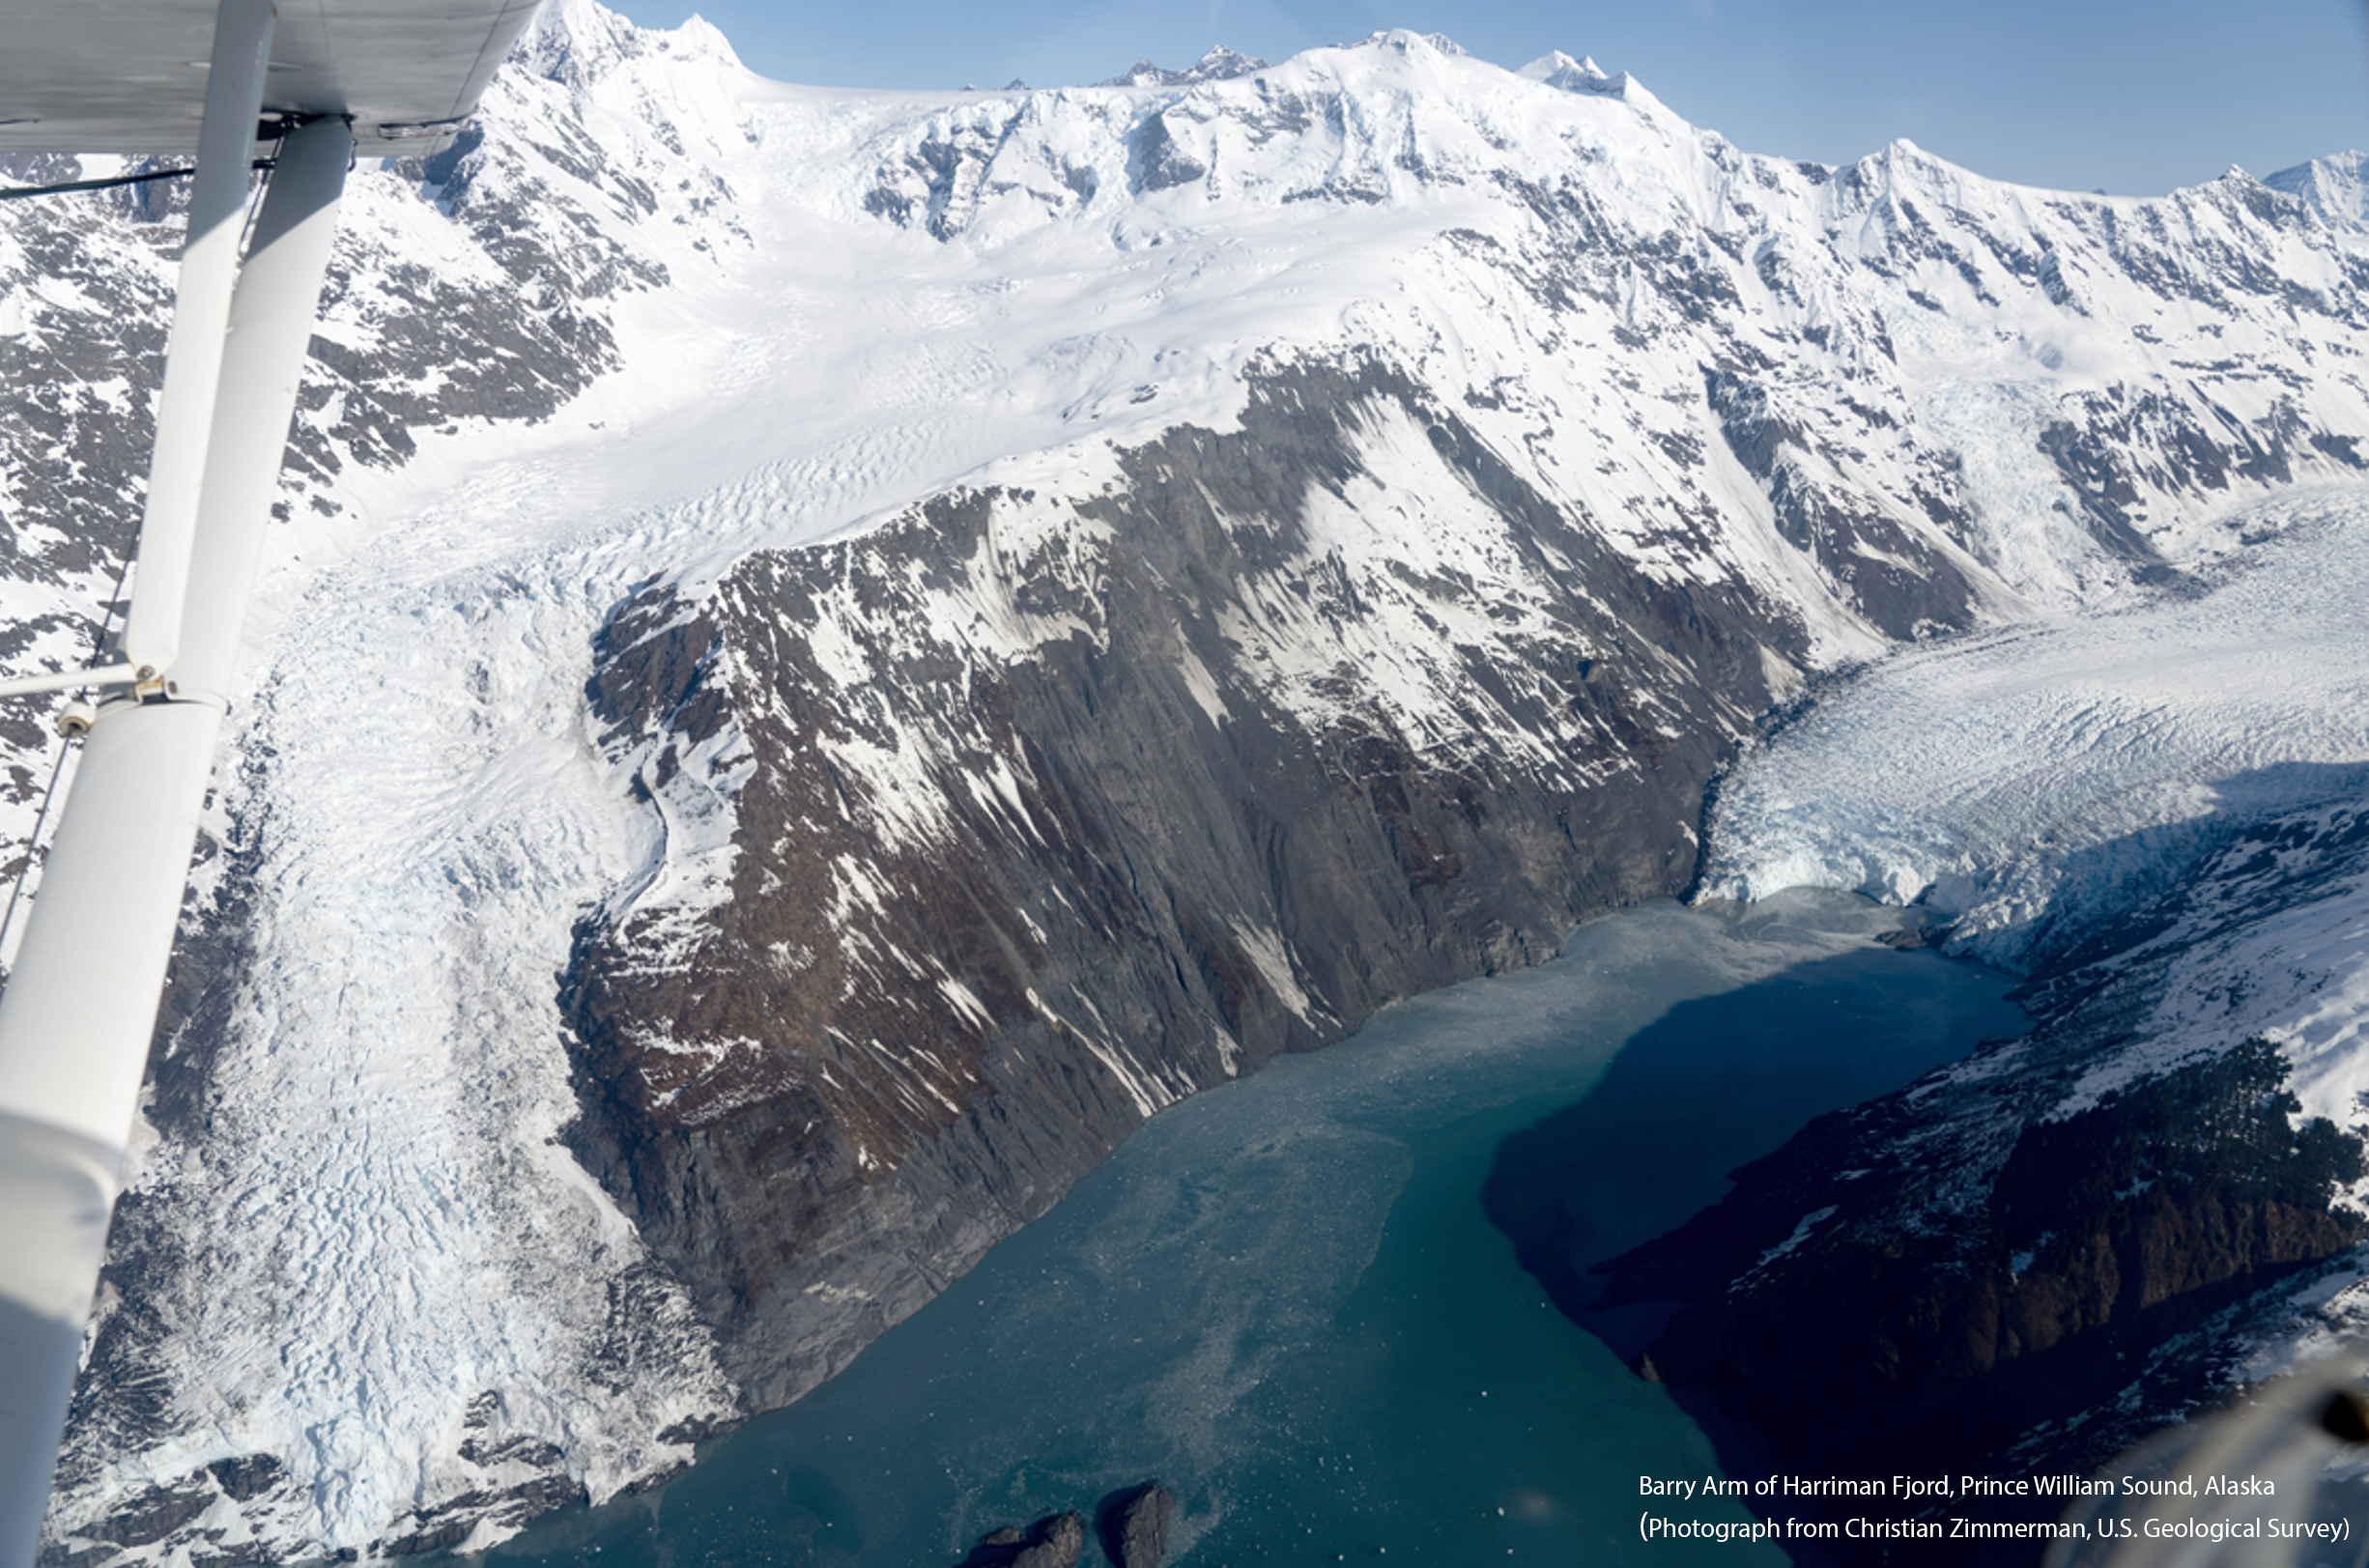
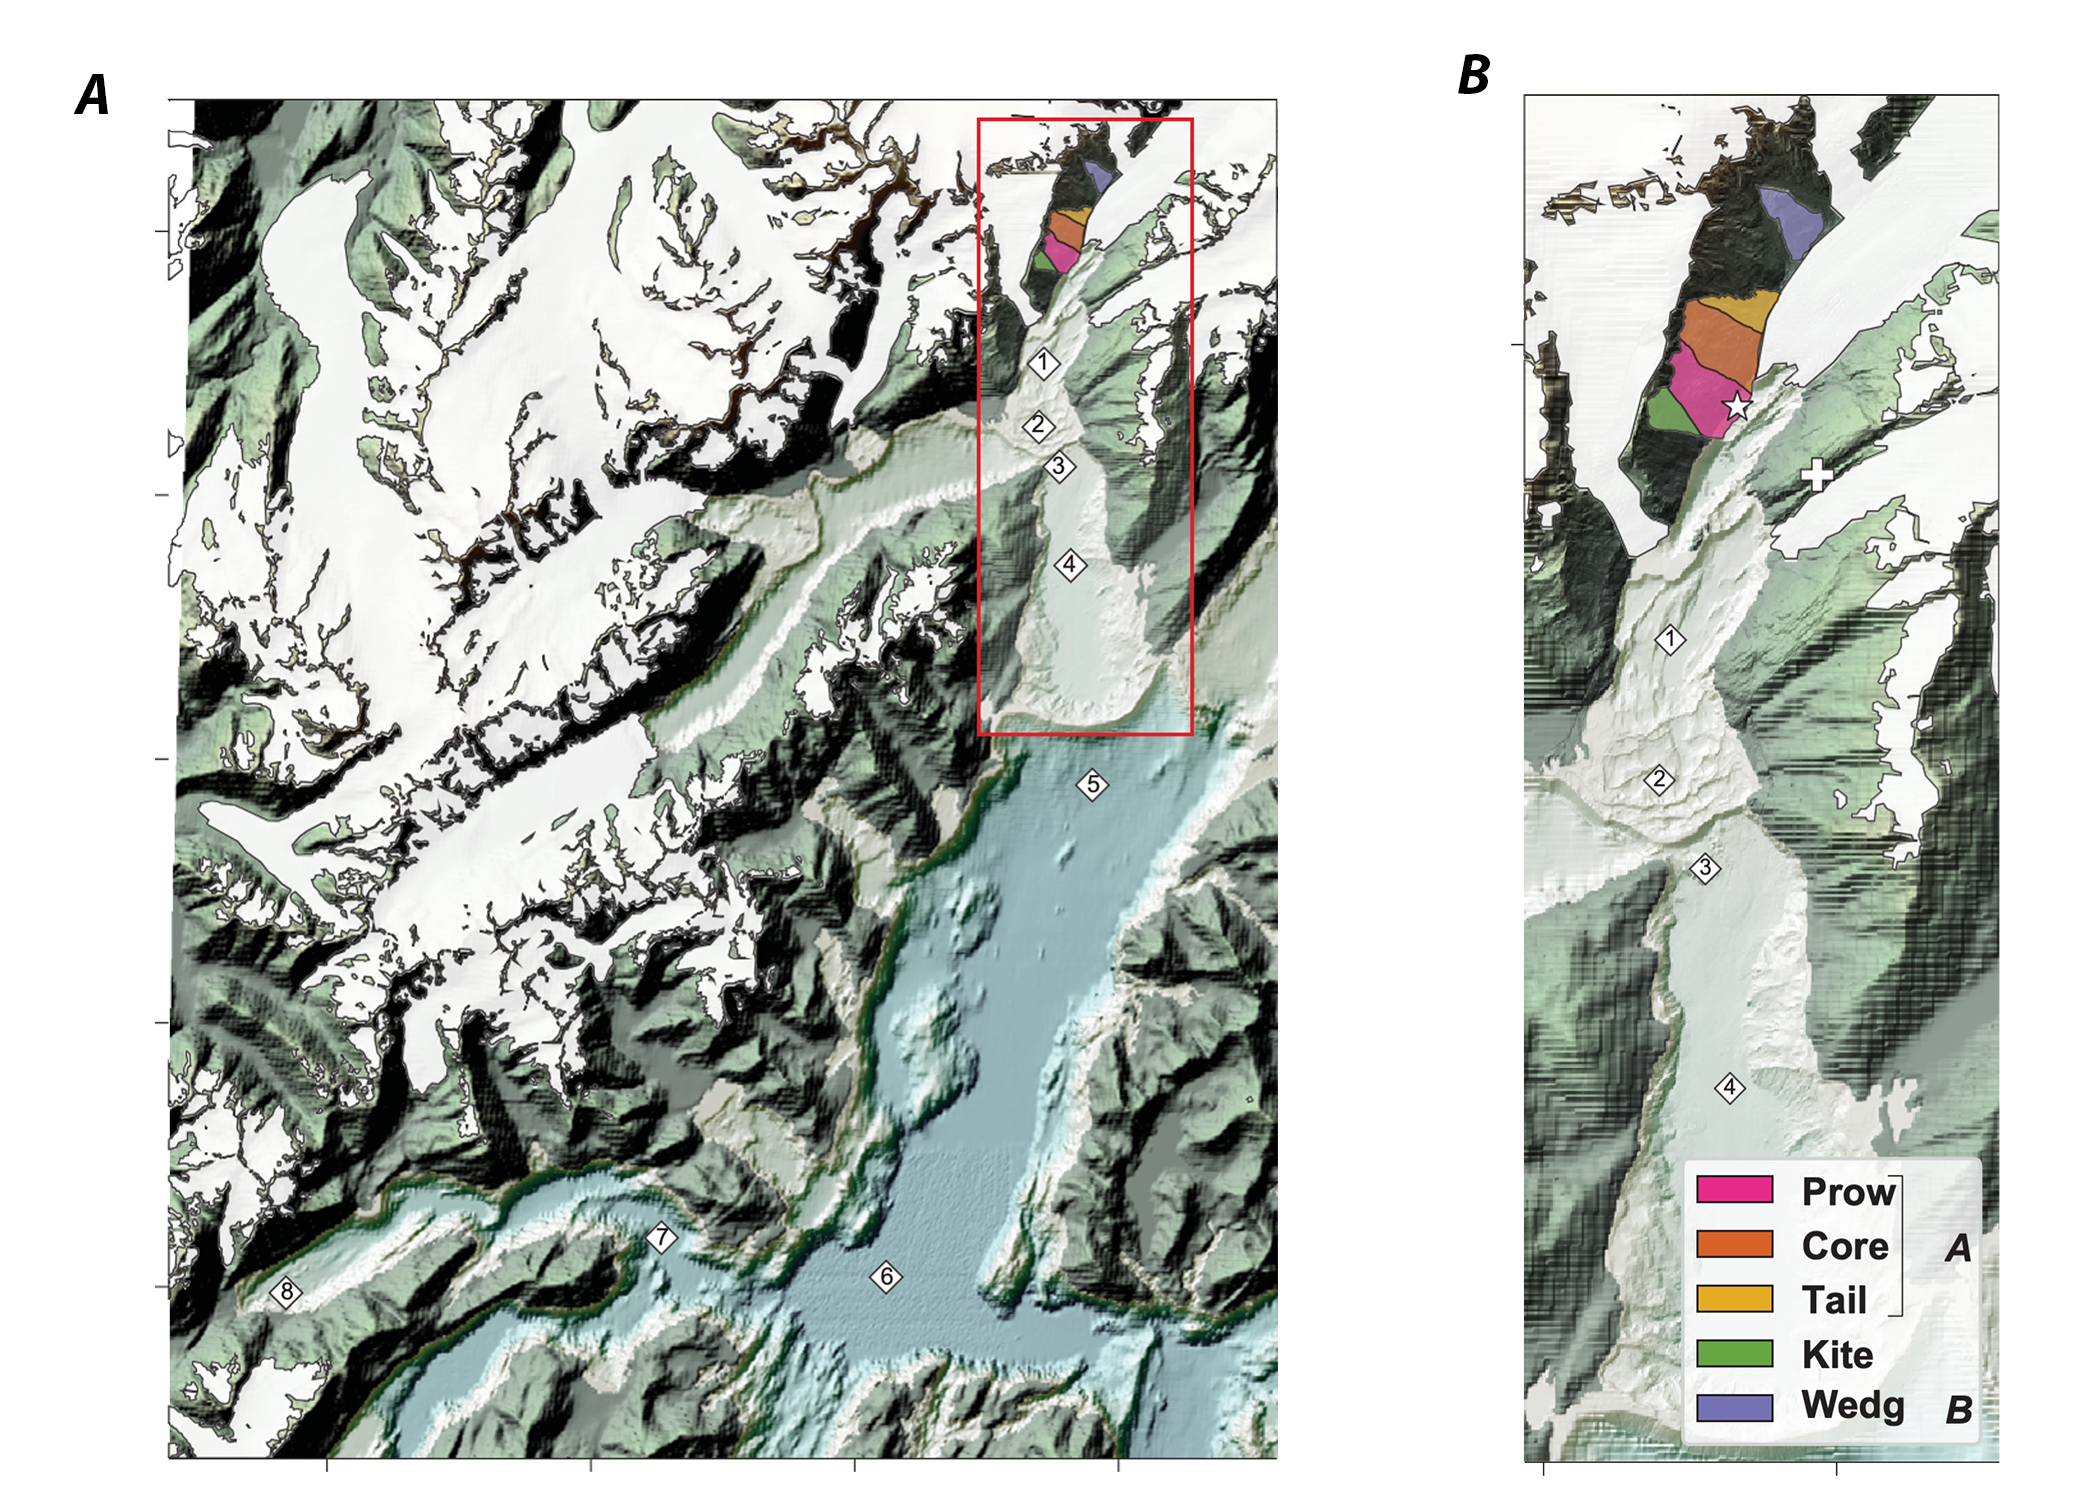
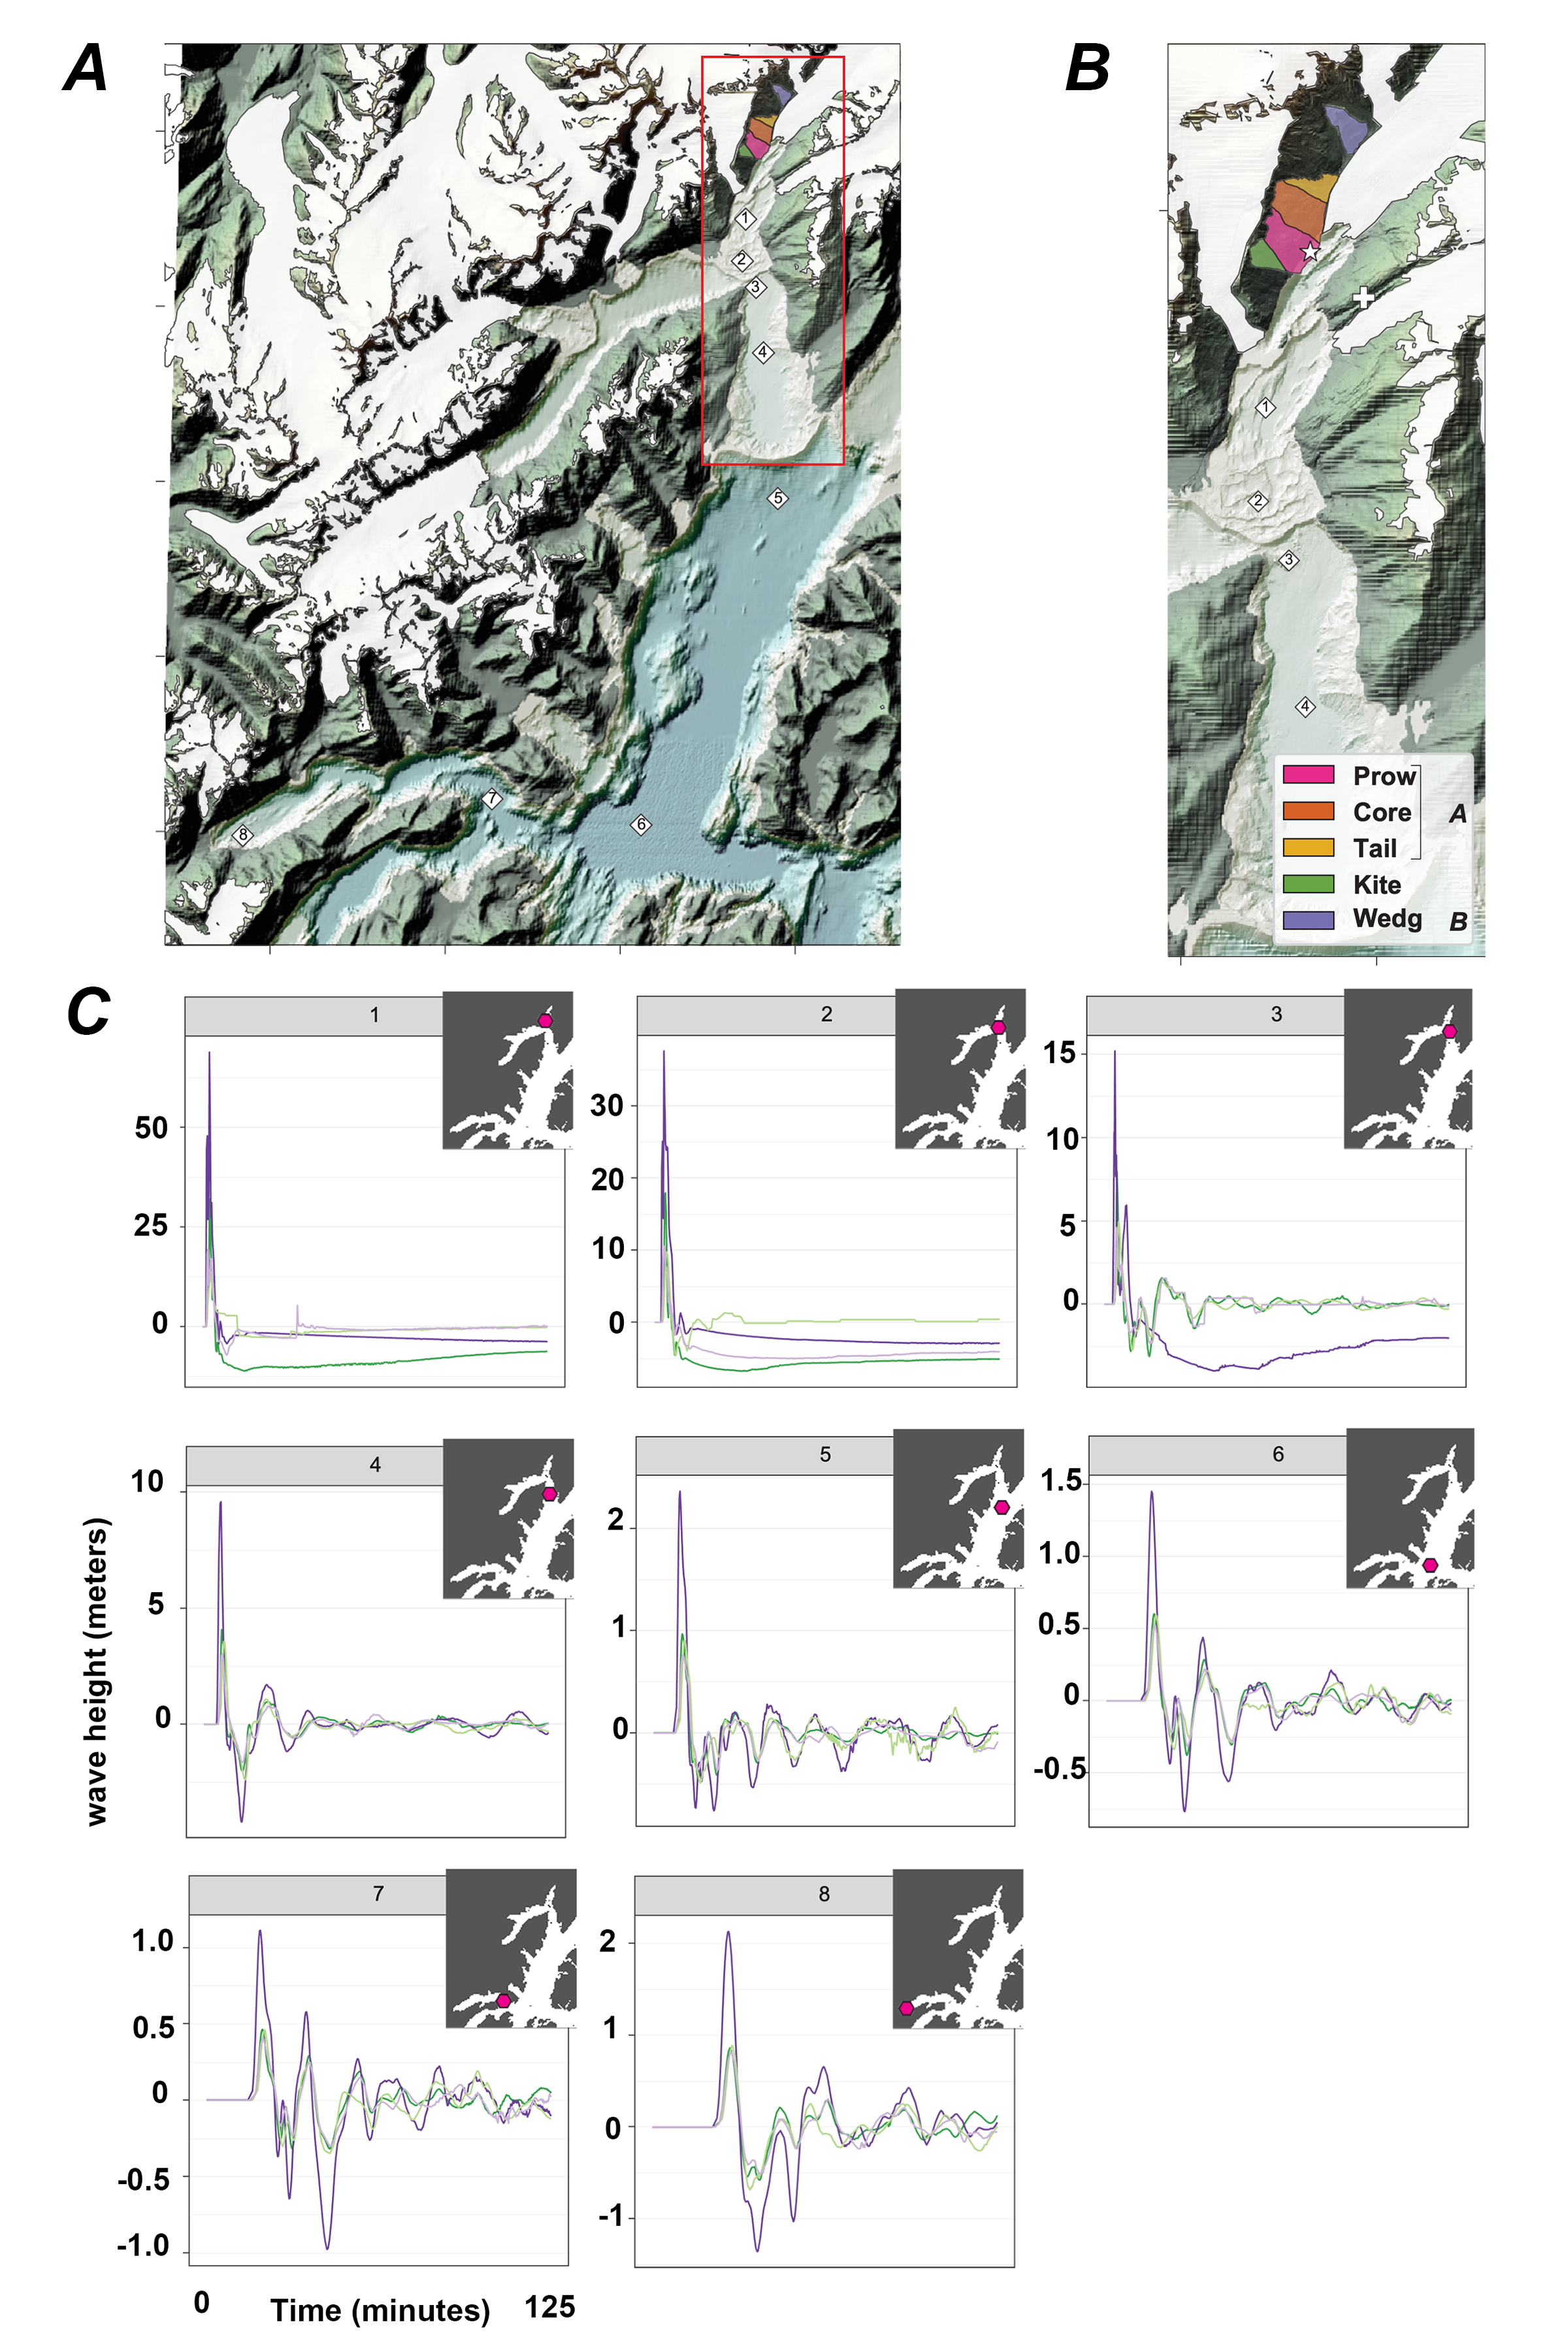
In spring 2020, a citizen scientist identified a large, potentially tsunamigenic landslide in Barry Arm (figs. 1 and 2), a recently deglaciated fjord in Prince William Sound, Alaska (Dai and others, 2020). Here, the northwest flank of the fjord side wall has destabilized into at least three large, slow-moving landslides (fig. 2; Schaefer and others, 2020). Evidence for motion at the largest landslide (named Landslide A) extends back to 1957, with more rapid movement between 2010 and 2017 coincident with the retreat of the Barry Glacier calving front (Dai and others, 2020). During 2020, remote interferometric synthetic aperture radar (InSAR) monitoring revealed seasonally isolated movement of Landslide A of about 17 centimeters (cm) between September 23 and October 17 (Schaefer and others, 2020). Based on strike slip and oblique slip faults located within Landslide A, Coe and others (2021) subdivided Landslide A into three kinematic elements (fig. 2; the Prow, Core, and Tail). The kinematic element boundaries reflect past deformational history and may change based on future deformation. The second landslide, Landslide B or the Wedge, is located up valley to the northeast of Landslide A. It was identified during InSAR analysis in summer 2020 and confirmed as an active landslide by InSAR deformation and structure mapping (Schaefer and others, 2020). The third landslide was identified based on differencing of June and October 2020 light detection and ranging (lidar) data by the Alaska Division of Geology & Geophysical Surveys (DGGS). This analysis revealed rapid movement of an area adjacent to Landslide A called the Kite (fig. 2) and a significant rockfall that mobilized as a rock avalanche from the headscarp of Landslide A (DGGS, 2021). The planimetric extent of Landslide A and the Kite are adjacent; however, the structural mapping and lidar differencing (DGGS, 2021) indicate that these landslides moved independently in 2020. Although recent landslide kinematics are relatively well constrained, little is known about the potential for future rapid motion, landslide volumes, and timescale over which the hazard will persist.
For this preliminary report, we simulated the generation and propagation of a tsunami originating from the concurrent rapid motion of Landslides A and B and the Kite into the adjacent fjord water. Our primary goal was to advance our understanding of potential tsunamigenic landslide hazards for the Barry Arm landslides using a coupled landslide runout and wave propagation model. Our results support the National Oceanic and Atmospheric Administration (NOAA) National Tsunami Warning Center’s mission to provide reliable detection, forecasting, and warning of tsunamis to protect life and property. Our methods advance upon existing work (for example, the tsunami modeling of Dai and others, 2020) through the direct treatment of landslide physics using the model D-Claw and incorporation of topographic and bathymetric data collected in 2020 (NOAA, 2020; Daanen and others, 2021).
D-Claw is a depth-averaged, two-phase model capable of simulating motion of variable granular fluid mixtures, ranging from landslides to clear water, and has been used to simulate subaerial landslide tsunami generation (George and others, 2017). Rather than assume an initial location, wave height, and velocity for the tsunami, the use of D-Claw permits direct simulation of tsunami genesis from landslide motion into the fjord. Within, we consider only the case of all identified landslides rapidly moving together, two alternative landslide volumes constrained by observations of headscarp and toe angles, and two options for landslide mobility.
The larger of the two considered volumes represents the largest plausible volume, given current observational constraints. Additional observations may refine our understanding and could increase or decrease the estimated volume. Before this work was conducted, whether a landslide with material that is more mobile would produce a larger tsunami than a landslide with material is less mobile was not clear; accordingly, we considered both cases. Similarly, considering only the scenario in which all landslides rapidly move together is intended to represent the likely worst-case scenario that pro- duces the largest waves. Whether other landslide geometries or rapid landslide motion sequences will produce a larger wave is uncertain. For example, the following are other plausible scenarios: a sequence in which movement of an identified landslide destabilizes an adjacent, previously stable area; complex landslide-water-glacier interactions below Landslide B; or far-field tsunami-tidewater glacier interactions.
The newly available topographic and bathymetric data allow us to directly simulate the landslide and subsequent wave generation, rather than assume the magnitude of an initial wave. Our scenarios, topographic surface, and bathymetric surface are constrained by data collected after the preliminary modeling by Dai and others (2020), which simulated a series of hypothetical waves, generated not by landslide-water interaction, but as “hot start” initial wave conditions (more discussion of “hot start” initial conditions are discussed in “Model Description” section). We describe the approach of Dai and others (2020) and compare our results with theirs in the “Discussion” section.
Our results reflect a refinement on anticipated wave heights near the landslide, as well as in more distal locations in Prince William Sound, including at Passage Canal near the town of Whittier, Alaska.
Landslide failure surface
Which portions of Landslide A, Landslide B, and the Kite will further destabilize, resulting in rapid landslide motion, is considerably uncertain. Additional unknowns include (1) whether these landslides may move together or separately, (2) what the landslide volumes are, and (3) how mobile each landslide is. To account for this uncertainty, we considered multiple scenarios (table 1) created by combining two land- slide volumes with two landslide mobilities. In this preliminary report, we considered only the case in which all three landslides fail concurrently. We used this scenario because we expect this choice to generate the largest subsequent wave. However, it may be the case that different scenarios than what was considered here would produce a larger wave (for example, different landslide geometries, material properties, landslide motion sequences, and (or) destabilization of areas not yet recognized as being susceptible to failure). Further, identifying the relative or absolute likelihood for rapid motion of each landslide or kinematic element is beyond the scope of this report; therefore, we consider the scenario in which all rapidly move together. We additionally note that our scenario design is meant to represent synchronous rapid motion of the landslides from intrinsic factors, rather than motion that might occur associated with an earthquake or other exogenous event. Strong ground motion might result in additional locations of ground failure and the generation of tsunamis by multiple landslides and (or) coseismic seafloor motion.
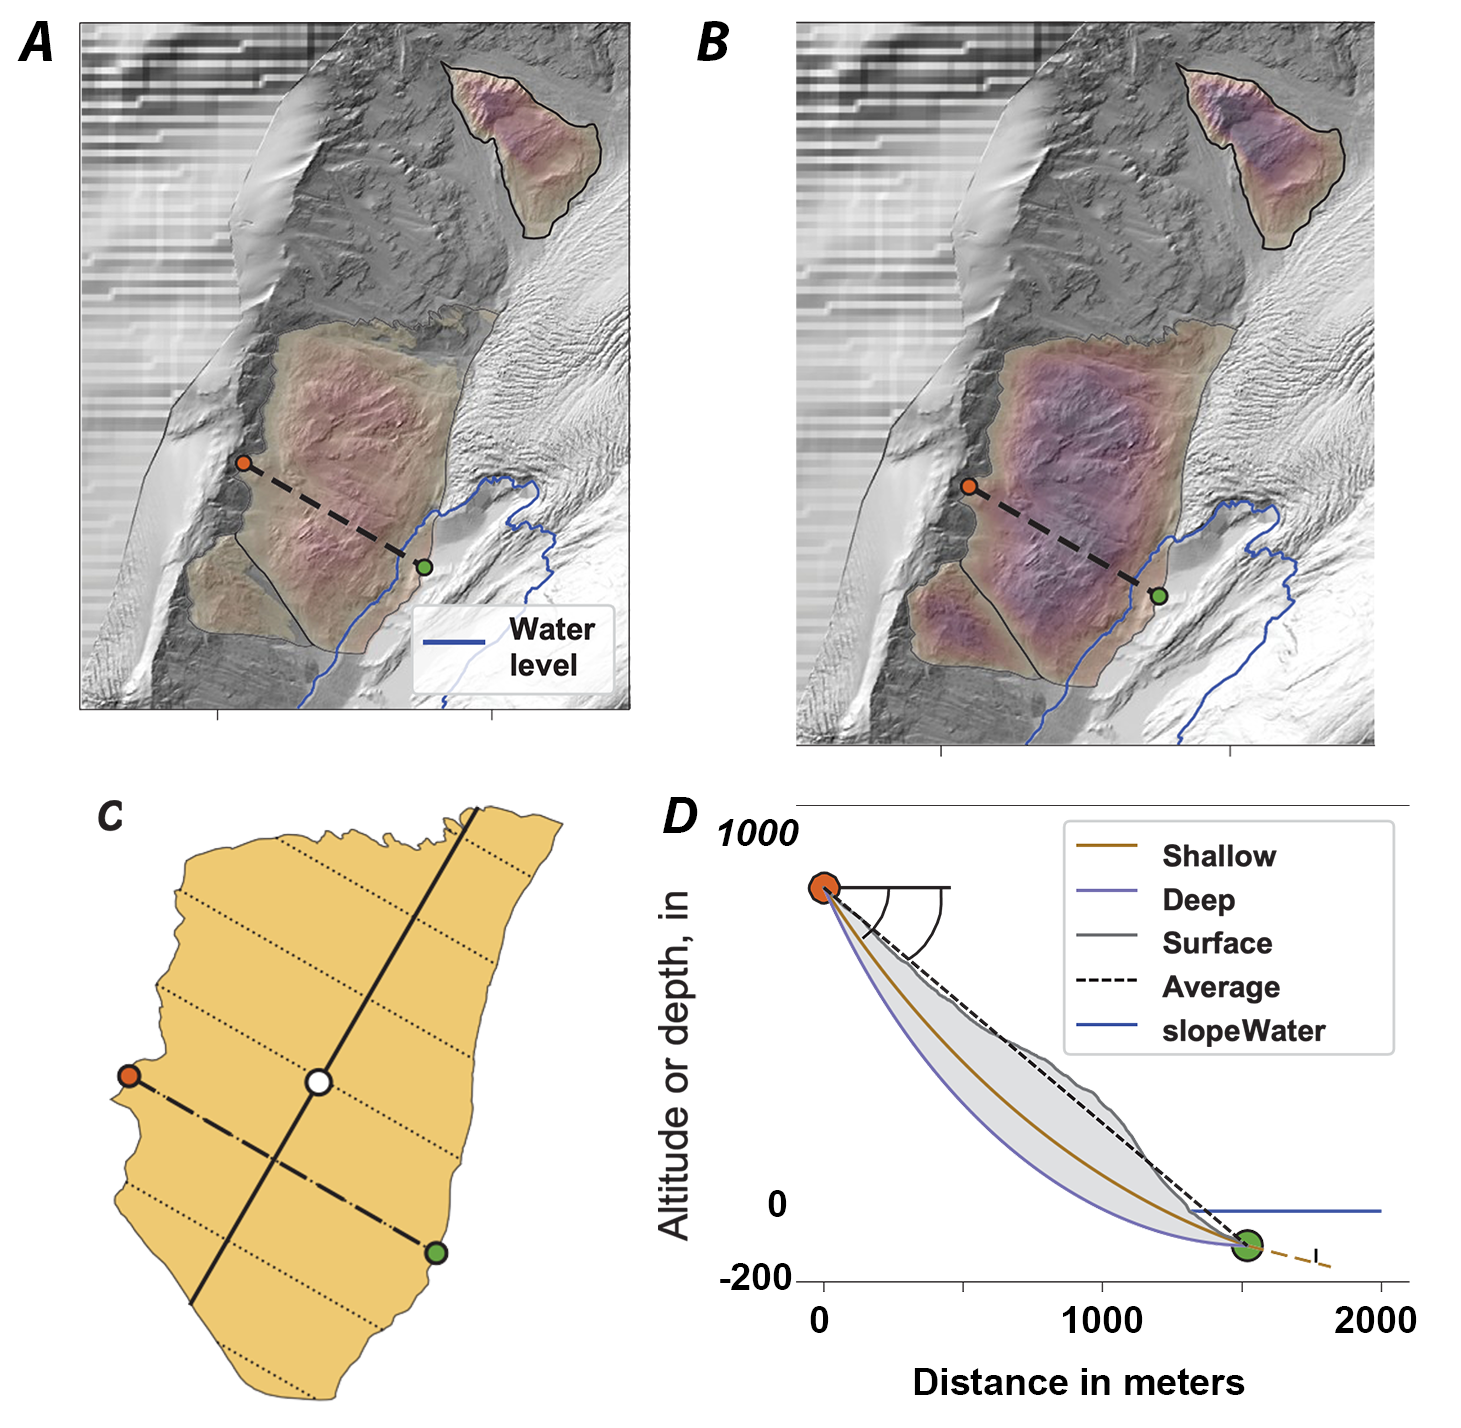
The choice to consider the rapid motion of all three landslides enforces the planimetric extent of the landslide region, but there is additional uncertainty in the spatially variable depth to the landslide failure surface and thus the landslide volume. The failure surface is the surface between destabilized material (above), which may rapidly move, and stable material (below). In this preliminary report, we did not undertake extensive slope stability analysis (for example, Reid and others, 2000, 2015). Because no information was available regarding the depth of the failure surfaces or their geometry, we approximated the failure surface with a series of logarithmic spirals oriented in the downslope direction (fig. 3).
Results
The combination of our two options for landslide volume and two options for landslide mobility yields four scenarios which we name C-290, NC-290, C-689, and NC-689. The scenario names reflect the combination of landslide mobility (C, contractive; NC, noncontractive) and landslide size (290 or 689 ×106 m3). Thus, scenario C-290 refers to the contractive, more mobile, smaller landslide with a total landslide volume of 290 × 106 m3.
Simulations were initialized with water (pure fluid) in the ocean and the ocean surface at rest and a granular-fluid mixture with no velocity in each of the three landslide source regions. Pore pressure was initialized to hydrostatic pressure. D-Claw supports adaptive mesh refinement, and we used a computational grid cell size of 50 m around the landslide and along the wave propagation path. Preliminary simulations tested smaller grid cell sizes (5 m) and yielded similar results. In the portions of the domain where no wave propagated, the cell size was permitted to remain at a coarse resolution of 1,000 m.
We considered four landslide scenarios, each resulting in tsunami generation. After the simulations commence at time zero, the landslide material immediately moves into the fjord water with most landslide material entering the water within 30 seconds of simulated time. The landslide motion generates a tsunami by displacing fjord water and exchanging momentum with it. The largest wave was generated by the larger, contractive, more mobile scenario C-689. As shown in figure 5, this scenario inundates a larger portion of the fjord than the other scenarios and does so more quickly. In describing the results, we adopt the terminology introduced by Walder and others (2003) to describe spatial domains. The splash zone is near the landslide source and runout areas and is characterized by complex hydrodynamics: in the near field, the tsunami organizes into a coherent wave and in the far field, the tsunami dispersive effects become important. Scenario C-689 generates waves of almost 200 m in height in the splash zone. These waves reach Whittier, Alaska, in just over 20 min. Peak wave height in Whittier, Alaska, occurs at 26 min. At the transition between the splash zone and the near field, located just north of the junction of Harriman Fjord and Barry Arm, scenario C-689 generates a wave of 25 m. This wave attenuates to just over 2 m at gage 8, located 500 m off- shore Whittier, Alaska, in Passage Fjord. All other scenarios result in a wave of just under 1 m at gage 8.
Conclusions
The main points of the report are as follows:
- Simulation of landslide motion and subsequent tsunami generation at Barry Arm was made possible by newly collected light detection and ranging (lidar) and bathymetric data.
- Specific treatment of landslide volume and mobility influences the tsunami height, with the largest and most mobile landslide scenario producing the largest wave, and all other scenarios producing similar but smaller waves.
- Our largest modeled wave heights result from the largest plausible failure volume and a highly mobile landslide. These wave heights are similar to the smallest wave scenario presented by Dai and others (2020), even though the landslide volume considered here is greater.
-
The largest scenario results in a wave with just over 2 m of height 500 meters offshore Whittier, Alaska. This wave arrives in Whittier, Alaska, approximately 20 minutes (min) after initial landslide motion and peaks 26 min after initial motion. Simulated wave heights exceeding 5 m are common throughout Barry Arm and Harriman Fjord and peak within 10 min of initial landslide motion.
- The results presented here differ from the prior simulations presented in Dai and others (2020) because we are able to directly simulate the landslide entering the ocean. We also have current bathymetric data that were not yet available during the analysis included in their paper. We compared our results to these prior simulations by examining our simulated wave heights at the location where our simulated wave becomes coherent and directed down fjord (near Point Doran). At this location, the peak wave heights from our largest scenario are approximately 25 meters. On this basis, we conclude that our largest wave-generating scenario (C-689) is most directly comparable with the smallest scenario considered by Dai and others (2020), which used a 25-m initial wave crest height. When we compare our simulated gage traces at Whittier, Alaska, from scenario C-689 with the 25-m initial wave scenario (fig. S9 in Dai and others, 2020), we find both simulations yield a maximum wave height of around 2 m and a peak wave time of about 26 min.
We conclude by describing the limitations of this preliminary report. Herein, we only considered four scenarios based on currently available data. Given these data, these scenarios are intended to reflect uncertainty in landslide size and mobility and to demonstrate how this uncertainty propagates into tsunami height. We consider only the case in which all three landslides fail concurrently. This scenario design was intended to constrain the largest plausible tsunami-generating landslide and help inform the tsunami warning system. Other scenarios not considered here could result in a larger wave (for example, landslides that move because of an earthquake or a sequence of landslides). Finally, our simulations with D-Claw permit seamless simulation of wave initiation by the landslides but they may produce different results than other methods for landslide-derived wave initiation (for example, vertical seafloor move- ment, multilayer models) or application of codes that use differ- ent wave models (for example, shallow water versus Boussinesq type). The results presented here emphasize the importance of up-to-date topographic and bathymetric data for identifying, assessing, and simulating the potential hazard of tsunamigenic landslides, particularly in recently deglaciated areas where new subaerial and submarine terrain is being revealed.
References
- Coe, J.A., Wolken, G.J., Daanen, R.P., and Schmitt, R.G., 2021, Map of landslide structures and kinematic elements at Barry Arm, Alaska in the summer of 2020: U.S. Geological Survey data release, https://doi.org/10.5066/P9EUCGJQ.
- Daanen, R.P., Wolken, G.J., Wikstrom Jones, K., and Herbst, A.M., 2021, High resolution lidar-derived elevation data for Barry Arm landslide, southcentral Alaska, June 26, 2020: Alaska Division of Geological & Geophysical Surveys Raw Data File 2021–3, 9 p.
- Dai, C., Higman, B., Lynett, P.J., Jacquemart, M., Howat, I.M., Liljedahl, A.K., Dufresne, A., Freymueller, J.T., Geertsema, M., Ward Jones, M., and Haeussler, P., 2020, Detection and assessment of a large and potentially tsunamigenic periglacial landslide in Barry Arm, Alaska: Geophysical Research Letters, v. 47, no. 22.
- Gauthier, D., Anderson, S.A., Fritz, H.M., and Giachetti, T., 2018, Karrat Fjord (Greenland) tsunamigenic landslide of 17 June 2017—Initial 3D observations: Landslides, v. 15, no. 2, p. 327–332.
- George, D.L., and Iverson, R.M., 2014, A depth-averaged debris-flow model that includes the effects of evolving dilatancy—II. Numerical predictions and experimental tests: Proceedings of the Royal Society of London. Series A, v. 470, no. 2170, p. 20130820, https://doi.org/10.1098/rspa.2013.0820.
- George, D.L., Iverson, R.M., and Cannon, C.M., 2017, New methodology for computing tsunami generation by subaerial landslides—Application to the 2015 Tyndall Glacier landslide, Alaska: Geophysical Research Letters, v. 44, no. 14, p. 7276–7284, https://doi.org/10.1002/2017GL074341.
- Haeussler, P.J., Gulick, S.P.S., McCall, N., Walton, M., Reece, R., Larsen, C., Shugar, D.H., Geertsema, J., Venditti, G., and Labay, K., 2018, Submarine deposition of a subaerial landslide in Taan Fiord, Alaska: Journal of Geophysical Research, Earth Surface, v. 123, no. 10, p. 2443–2463, https://doi.org/10.1029/2018JF004608.
- Higman, B., et al., 2018, The 2015 landslide and tsunami in Taan Fiord, Alaska: Scientific Reports, v. 8, no. 1, p. 12993, https://doi.org/10.1038/s41598-018-30475-w.
- Iverson, R.M., and George, D.L., 2014, A depth-averaged debris-flow model that includes the effects of evolving dilatancy—I. Physical basis: Proceedings of the Royal Society of London. Series A, v. 470, no. 2170, p. 20130819, https://doi.org/10.1098/rspa.2013.0819.
- Kirby, J.T., Shi, F., Nicolsky, D., and Misra, S., 2016, The 27 April 1975 Kitimat, British Columbia, submarine landslide tsunami—A comparison of modeling approaches: Landslides, v. 13, no. 6, p. 1421–1434, https://doi.org/10.1007/s10346-016-0682-x.
- Miller, D.J., 1960a, The Alaska earthquake of July 10, 1958—Giant wave in Lituya Bay: Bulletin of the Seismological Society of America, v. 50, no. 2, p. 253–266, https://pubs.geoscienceworld.org/ssa/bssa/article-pdf/50/2/253/2692623/BSSA0500020253.pdf.
- Poli, P., 2017, Creep and slip—Seismic precursors to the Nuugaatsiaq landslide (Greenland): Geophysical Research Letters, v. 44, no. 17, p. 8832–8836, accessed June 17, 2021, at https://doi.org/10.1002/2017GL075039.
- Schaefer, L.N., Coe, J.A., Godt, J.W., and Wolken, G.J., 2020, Interferometric synthetic aperture radar data from 2020 for landslides at Barry Arm Fjord, Alaska (ver. 1.4, November 2020): U.S. Geological Survey data release, https://doi.org/10.5066/P9Z04LNK.
- Walder, J.S., Watts, P., Sorensen, O.E., and Janssen, K., 2003, Tsunamis generated by subaerial mass flows: Journal of Geophysical Research: Solid Earth, v. 108, no. B5, 19 p, https://doi.org/10.1029/2001JB000707.